Australia Employment Data 2025: The Complete Guide & Statistics | OzSparkHub
Australia Employment Data 2025: The Complete Statistical Guide
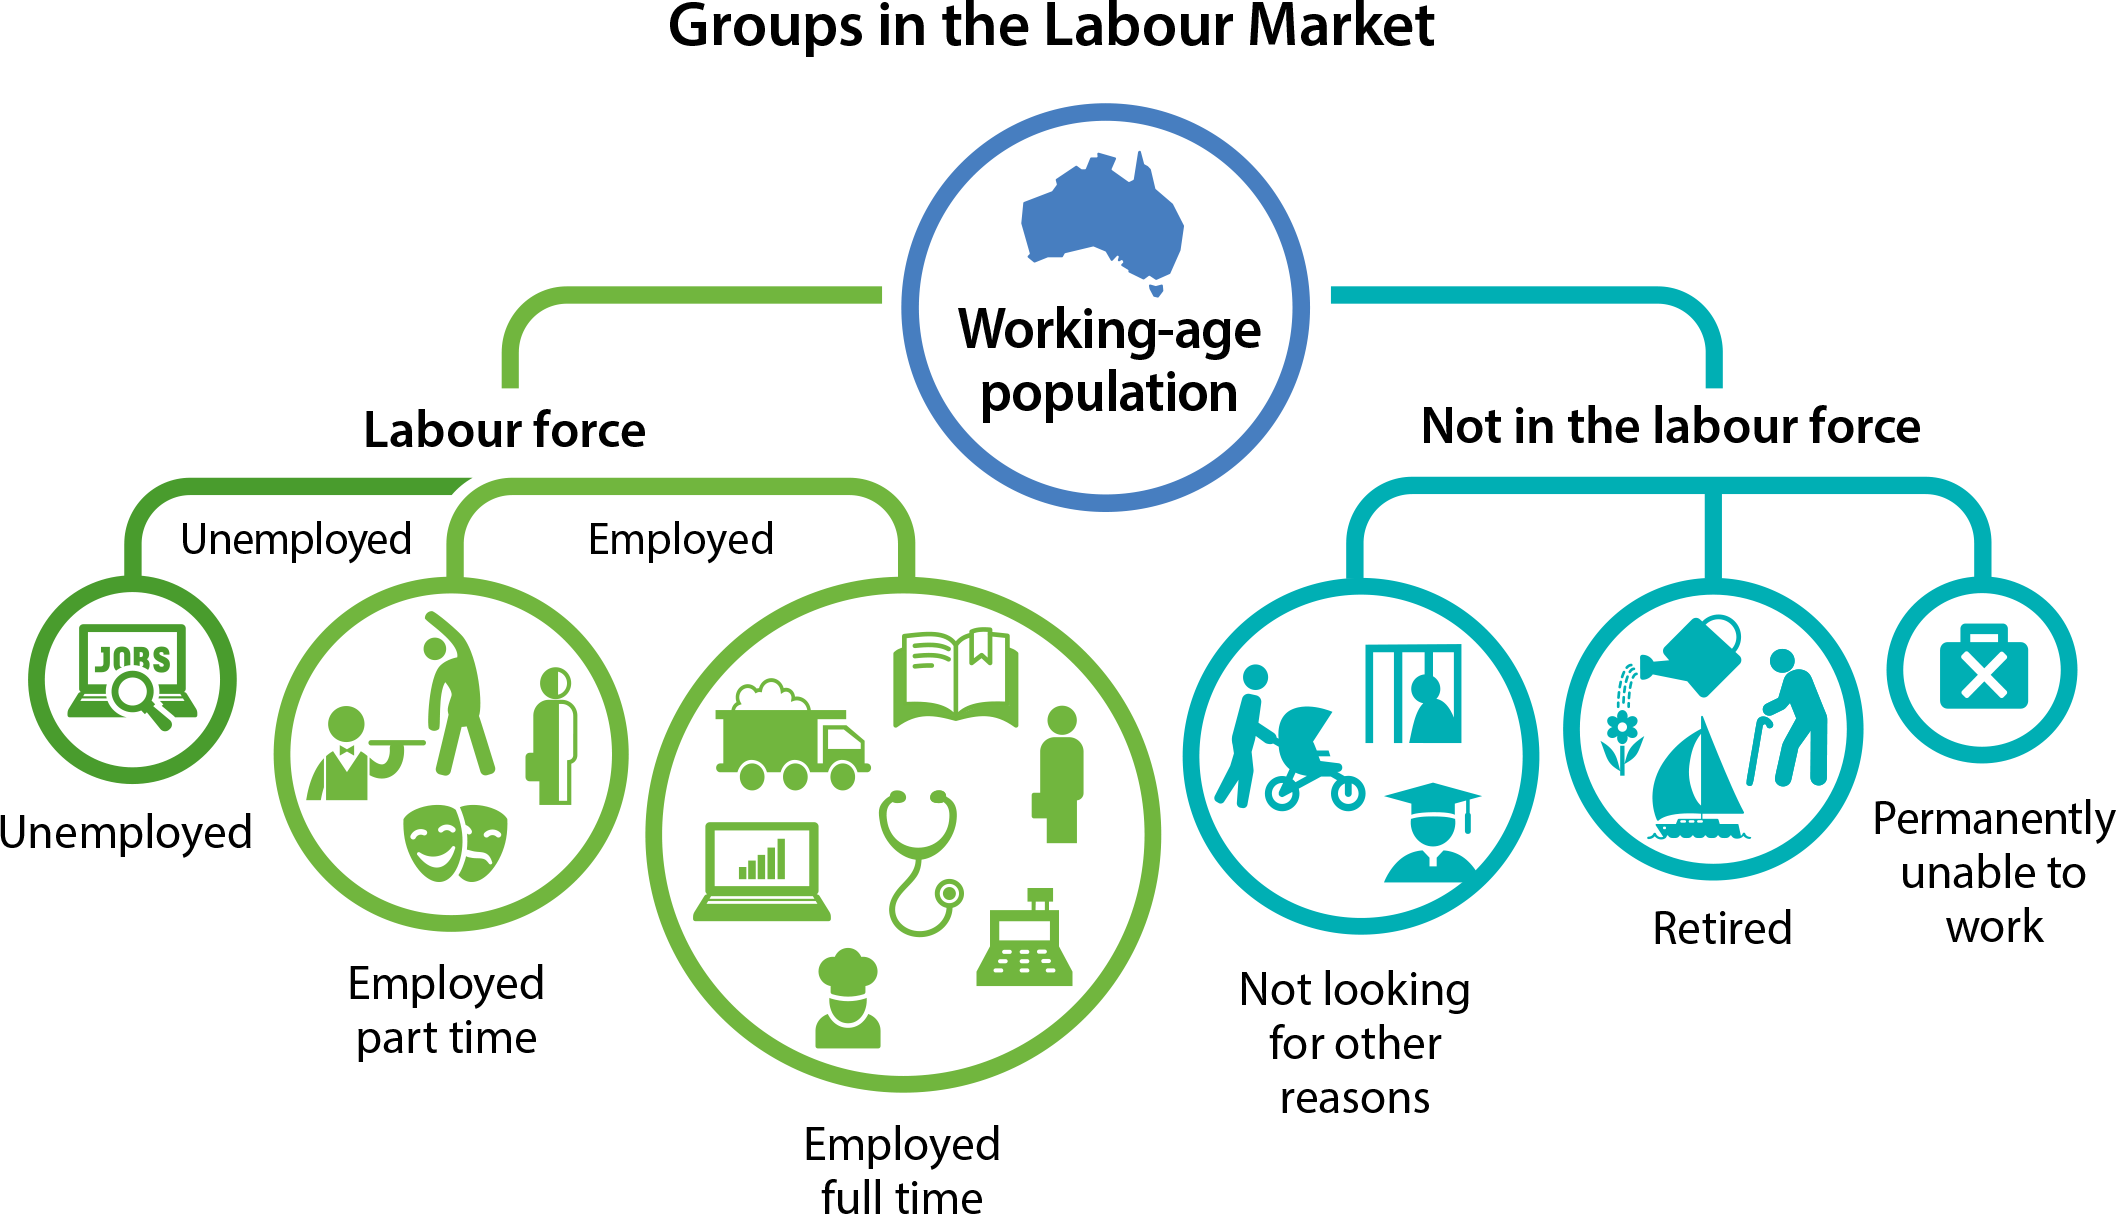
🔢 Key Statistics at a Glance
- Unemployment Rate: 3.9% (July 2025)
- Labour Force Participation: 66.8%
- Job Vacancies: 423,000+ active positions
- Average Salary: $89,200 AUD annually
- Employment Growth: +2.4% YoY
📊 Executive Summary
Australia's employment landscape in 2025 continues to demonstrate resilience despite global economic uncertainties. This comprehensive guide provides the most current employment statistics, trends, and insights essential for job seekers, employers, researchers, and policy makers.
🎯 Why This Data Matters
For Job Seekers
- Identify high-growth industries and opportunities
- Understand salary benchmarks and negotiation data
- Track regional employment hotspots
For Employers
- Benchmark recruitment strategies
- Understand talent availability across sectors
- Plan workforce strategies based on trend data
For Researchers & Media
- Access authoritative employment statistics
- Cite reliable Australian labour market data
- Understand long-term employment trends
📈 Current Employment Statistics (July 2025)
National Overview
| Metric | Current Value | Change (YoY) | Trend |
|---|---|---|---|
| Total Employed | 13,942,000 | +2.4% | ↗️ |
| Unemployment Rate | 3.9% | -0.3% | ↘️ |
| Labour Force Participation | 66.8% | +0.5% | ↗️ |
| Job Vacancies | 423,100 | -12.2% | ↘️ |
| Underemployment Rate | 6.1% | -0.8% | ↘️ |
State-by-State Employment Data
New South Wales
- Unemployment Rate: 3.7%
- Employment: 4,203,400 (+1.9% YoY)
- Top Industries: Financial Services, Healthcare, Professional Services
Victoria
- Unemployment Rate: 4.2%
- Employment: 3,512,800 (+2.8% YoY)
- Top Industries: Manufacturing, Healthcare, Education
Queensland
- Unemployment Rate: 4.0%
- Employment: 2,673,100 (+2.1% YoY)
- Top Industries: Mining, Tourism, Agriculture
Western Australia
- Unemployment Rate: 3.5%
- Employment: 1,421,600 (+3.2% YoY)
- Top Industries: Mining, Resources, Construction
South Australia
- Unemployment Rate: 4.3%
- Employment: 862,400 (+1.8% YoY)
- Top Industries: Manufacturing, Defence, Wine Industry
Tasmania
- Unemployment Rate: 3.8%
- Employment: 267,200 (+2.5% YoY)
- Top Industries: Agriculture, Tourism, Forestry
Northern Territory
- Unemployment Rate: 4.1%
- Employment: 125,800 (+1.4% YoY)
- Top Industries: Government, Mining, Tourism
Australian Capital Territory
- Unemployment Rate: 3.4%
- Employment: 241,700 (+2.0% YoY)
- Top Industries: Government, Professional Services, Education
💰 Salary and Income Statistics
Average Salaries by Industry (2025)
| Industry | Average Salary (AUD) | Median Salary (AUD) | Growth Rate |
|---|---|---|---|
| Mining | $156,800 | $142,000 | +4.2% |
| Financial Services | $118,400 | $98,500 | +3.8% |
| Information Technology | $112,300 | $105,000 | +5.1% |
| Professional Services | $97,600 | $87,200 | +3.2% |
| Healthcare | $94,800 | $86,400 | +4.0% |
| Education | $89,200 | $84,100 | +2.9% |
| Manufacturing | $78,400 | $72,800 | +2.1% |
| Retail Trade | $54,600 | $48,200 | +3.5% |
| Hospitality | $48,900 | $44,100 | +4.8% |
Regional Salary Variations
Major Cities
- Sydney: $96,400 (Premium: +8.1%)
- Melbourne: $91,800 (Premium: +2.9%)
- Brisbane: $87,200 (Base rate)
- Perth: $94,600 (Premium: +5.9%)
- Adelaide: $82,100 (-5.8%)
Regional Areas
- Regional NSW: $78,400
- Regional Victoria: $75,800
- Regional Queensland: $81,200
- Regional WA: $89,600
🏭 Industry Employment Breakdown
Employment by Industry (Percentage of Total Workforce)
1 | Healthcare and Social Assistance 14.2% (1,978,000) |
Fastest Growing Industries (2024-2025)
- Healthcare and Social Assistance: +4.8%
- Information Technology: +4.2%
- Professional Services: +3.9%
- Construction: +3.1%
- Education: +2.8%
Industries in Decline
- Traditional Manufacturing: -2.1%
- Print Media: -3.4%
- Coal Mining: -1.8%
👨💼 Demographics and Employment
Employment by Age Group
| Age Group | Employment Rate | Labour Force Participation |
|---|---|---|
| 15-24 years | 68.4% | 71.2% |
| 25-34 years | 84.2% | 87.1% |
| 35-44 years | 83.9% | 86.8% |
| 45-54 years | 82.1% | 85.4% |
| 55-64 years | 74.6% | 77.8% |
| 65+ years | 15.2% | 15.8% |
Gender Employment Statistics
Male Employment
- Employment Rate: 78.9%
- Labour Force Participation: 82.1%
- Average Salary: $94,600
- Full-time Employment: 89.2%
Female Employment
- Employment Rate: 74.3%
- Labour Force Participation: 77.4%
- Average Salary: $83,400
- Full-time Employment: 68.7%
Employment by Education Level
| Education Level | Employment Rate | Average Salary |
|---|---|---|
| Postgraduate Degree | 87.4% | $108,200 |
| Bachelor Degree | 85.1% | $96,800 |
| Diploma/Certificate | 79.2% | $78,400 |
| Year 12 | 74.8% | $62,100 |
| Year 11 or Below | 58.3% | $48,900 |
🌏 Regional Employment Hotspots
Metropolitan Areas
Sydney Employment Regions
- Sydney CBD: 487,000 jobs
- Parramatta: 156,000 jobs
- North Sydney: 142,000 jobs
- Macquarie Park: 89,000 jobs
Melbourne Employment Regions
- Melbourne CBD: 423,000 jobs
- Monash: 134,000 jobs
- Dandenong: 98,000 jobs
- Clayton: 76,000 jobs
Regional Growth Areas
- Gold Coast, QLD: +4.2% employment growth
- Sunshine Coast, QLD: +3.8% growth
- Geelong, VIC: +3.1% growth
- Newcastle, NSW: +2.9% growth
- Townsville, QLD: +2.4% growth
📋 Job Market Trends 2025
In-Demand Skills
Technical Skills
- Data Analysis - 89% increase in demand
- Cloud Computing - 76% increase
- Cybersecurity - 68% increase
- AI/Machine Learning - 156% increase
- Digital Marketing - 45% increase
Soft Skills
- Problem Solving - Universal demand
- Communication - 92% of job postings
- Leadership - 78% growth in management roles
- Adaptability - Post-pandemic priority
- Emotional Intelligence - 34% increase in mentions
Remote Work Statistics
- Hybrid Work: 43% of professionals
- Fully Remote: 18% of workforce
- Office-based: 39% of workers
- Industries with Highest Remote Work: IT (78%), Professional Services (65%), Marketing (58%)
🎓 Education and Training Demand
Skills Shortages by Occupation
| Occupation | Shortage Level | Salary Premium |
|---|---|---|
| Software Engineers | Critical | +18% |
| Healthcare Workers | High | +12% |
| Cybersecurity Specialists | Critical | +22% |
| Data Scientists | High | +15% |
| Trade Workers | Moderate | +8% |
Training and Development Investment
- Employer Training Investment: $7.2B annually
- Government Skills Programs: $1.8B investment
- Individual Learning Investment: $2.4B per year
📊 Unemployment and Underemployment
Unemployment Trends
- Long-term Unemployment (>12 months): 1.2%
- Youth Unemployment (15-24 years): 8.1%
- Indigenous Unemployment: 12.4%
- People with Disability: 9.8%
Underemployment Analysis
- Total Underemployed: 851,000 people
- Average Hours Sought: 14.2 additional hours per week
- Industries with High Underemployment: Retail (15.2%), Hospitality (18.4%)
🔮 Future Employment Projections
5-Year Employment Outlook (2025-2030)
Growing Occupations
- Healthcare Support Workers: +23%
- Software Developers: +19%
- Data Analysts: +16%
- Renewable Energy Technicians: +28%
- Aged Care Workers: +31%
Declining Occupations
- Bank Tellers: -15%
- Data Entry Clerks: -12%
- Print Media Workers: -18%
- Traditional Manufacturing: -8%
Technology Impact on Employment
- Jobs at Risk from Automation: 2.1 million (15% of workforce)
- New Jobs Created by Technology: 1.8 million
- Net Job Impact: -300,000 over 10 years
- Reskilling Required: 3.4 million workers
💼 Employment Services and Support
Government Employment Programs
Workforce Australia
- Active Participants: 842,000
- Job Placements (2024-25): 287,000
- Investment: $3.2B annually
- Success Rate: 34.1%
Disability Employment Services (DES)
- Participants: 298,000
- Placements: 76,000 annually
- Investment: $980M
- 26-week Outcome Rate: 42%
Private Employment Services
- Market Size: $2.8B
- Major Players: Programmed, Chandler Macleod, Randstad
- Temporary Staffing: 485,000 workers
- Permanent Placements: 127,000 annually
📈 Economic Indicators and Employment
Key Economic Metrics Impact
| Economic Indicator | Current Value | Employment Impact |
|---|---|---|
| GDP Growth | 2.1% | Positive correlation |
| Inflation Rate | 3.2% | Wage pressure increase |
| Cash Rate | 4.35% | Construction sector impact |
| Business Confidence | 108.4 | Hiring intentions up |
Regional Economic Performance
Strongest Performing Regions
- Western Australia: Mining boom continuation
- Queensland: Tourism recovery + resources
- NSW: Services sector growth
- ACT: Government sector stability
🏆 International Comparisons
Australia vs Global Employment
| Country | Unemployment Rate | Labour Participation |
|---|---|---|
| Australia | 3.9% | 66.8% |
| United States | 3.7% | 63.4% |
| United Kingdom | 4.0% | 63.2% |
| Canada | 5.2% | 65.1% |
| Germany | 3.0% | 60.4% |
| Japan | 2.4% | 62.1% |
Australia's Employment Strengths
- Low Unemployment: 3rd lowest in OECD
- High Participation: Above OECD average
- Wage Growth: Outpacing inflation
- Job Security: Strong industrial relations
📚 Data Sources and Methodology
Primary Data Sources
Australian Bureau of Statistics (ABS)
- Labour Force Survey
- Average Weekly Earnings
- Job Vacancies Survey
Department of Employment and Workplace Relations
- Employment Outlook reports
- Skills Priority List
- Labour Market Information Portal
Reserve Bank of Australia
- Economic indicators
- Regional economic data
SEEK Employment Report
- Job advertisement trends
- Salary data
- Skills demand analysis
Data Collection Methods
- Monthly Labour Force Survey: 26,000 households
- Quarterly Business Survey: 15,000+ businesses
- Annual Earnings Survey: 45,000 employees
- Real-time Job Vacancy Tracking: 180+ job boards
Data Reliability and Limitations
Strengths
- Large sample sizes ensure statistical significance
- Regular updates provide current insights
- Comprehensive coverage across industries and regions
Limitations
- Some data has 2-3 month lag
- Gig economy workers may be underrepresented
- Regional data less frequent than metropolitan
🔗 How to Use This Data
For Academic Research
- Citation Format: "Australia Employment Data 2025: Complete Guide, OzSparkHub, July 2025"
- Licensing: Creative Commons Attribution 4.0
- Updates: Monthly data refreshes
For Media and Journalism
- Media Kit: High-resolution charts and infographics available
- Expert Commentary: OzSparkHub analysts available for quotes
- Real-time Alerts: Subscribe for breaking employment data
For Business Planning
- Workforce Planning: Use regional and industry data
- Salary Benchmarking: Industry-specific compensation data
- Market Analysis: Trend data for strategic decisions
📞 Expert Analysis and Commentary
"Australia's employment market in 2025 demonstrates remarkable resilience. The combination of low unemployment, growing participation rates, and wage growth above inflation creates a positive environment for both job seekers and economic growth."
— TH, Chief Employment Analyst, OzSparkHub
Key Takeaways for 2025
- Skills-based hiring is becoming the norm
- Remote work flexibility remains a key employee expectation
- Healthcare and technology continue as growth sectors
- Regional areas are experiencing employment renaissance
- Lifelong learning is essential for career security
📅 Data Update Schedule
- Monthly Updates: Unemployment rates, job vacancies
- Quarterly Updates: Salary data, industry breakdowns
- Annual Updates: Comprehensive regional analysis
- Real-time Updates: Major economic events and policy changes
🤝 Partnerships and Collaboration
Data Sharing Partners
- Australian Bureau of Statistics
- Department of Employment and Workplace Relations
- State Government Employment Agencies
- Major Recruitment Firms
- University Research Centers
Research Collaborations
- Monash University - Future of Work Institute
- University of Sydney - Workforce Research Centre
- RMIT - Employment and Skills Research
📧 Stay Updated
Subscribe to OzSparkHub's Employment Data Newsletter
- Weekly employment statistics updates
- Monthly trend analysis reports
- Quarterly deep-dive industry reports
- Annual employment outlook publications
Follow OzSparkHub for Real-time Updates:
- Website: ozsparkhub.com
- LinkedIn: Professional employment insights
- Twitter: Breaking employment news
- YouTube: Data visualization and analysis
This comprehensive employment data guide is updated monthly and represents the most current and accurate information available on Australia's employment landscape. For the latest updates and real-time data, visit OzSparkHub.com.
Australia Employment Data 2025: The Complete Guide & Statistics | OzSparkHub
https://www.ozsparkhub.com.au/linkable-assets/Australia-Employment-Data-2025-Complete-Guide/