Maps
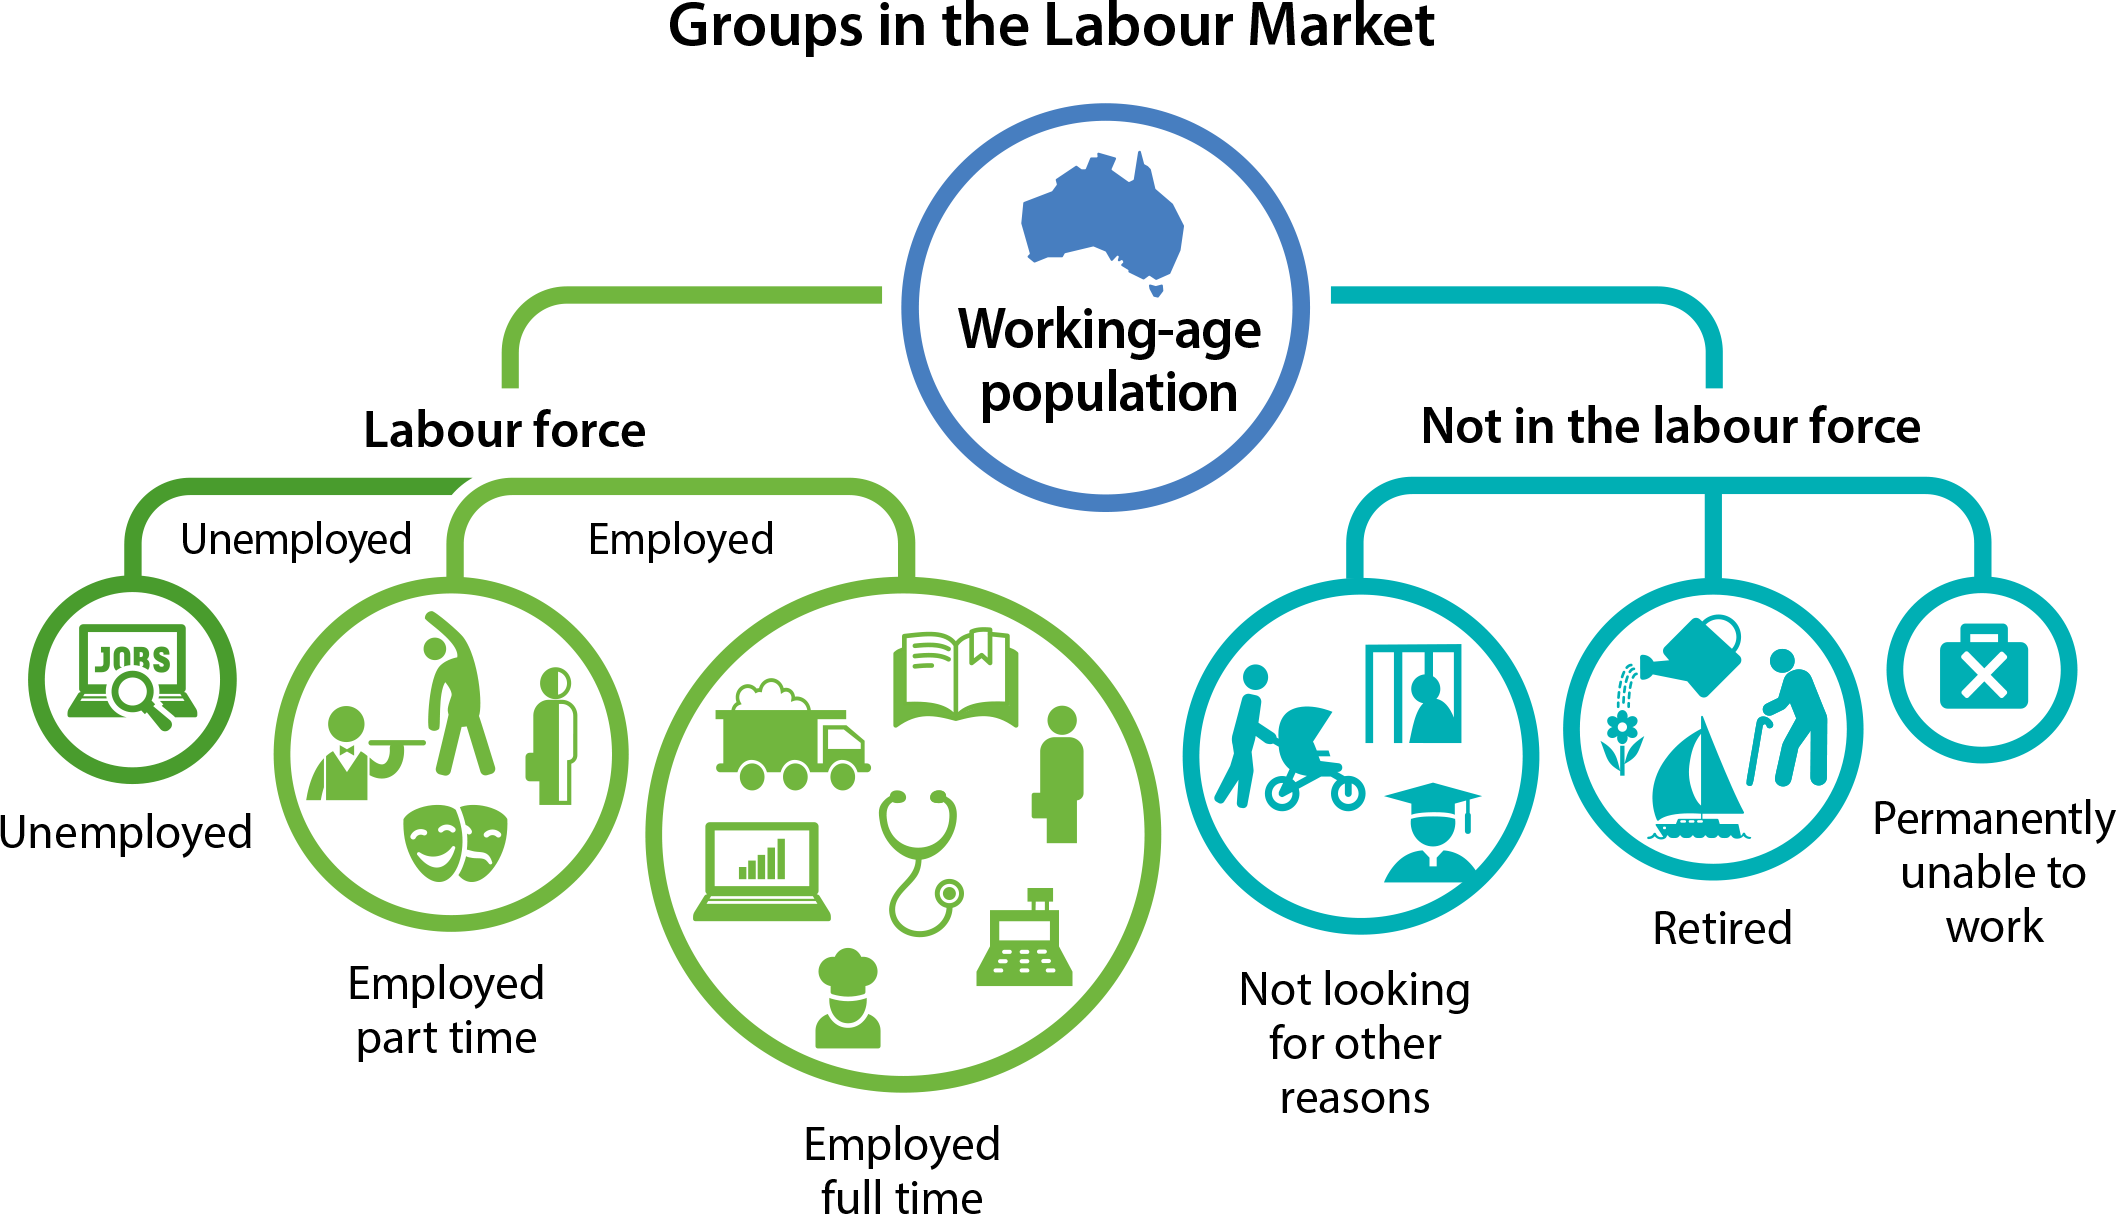
🗺️ Welcome to our comprehensive visualization dashboard for employment services across Australia. These interactive maps help you explore the distribution and accessibility of key employment support services nationwide.
📍 Available Interactive Maps
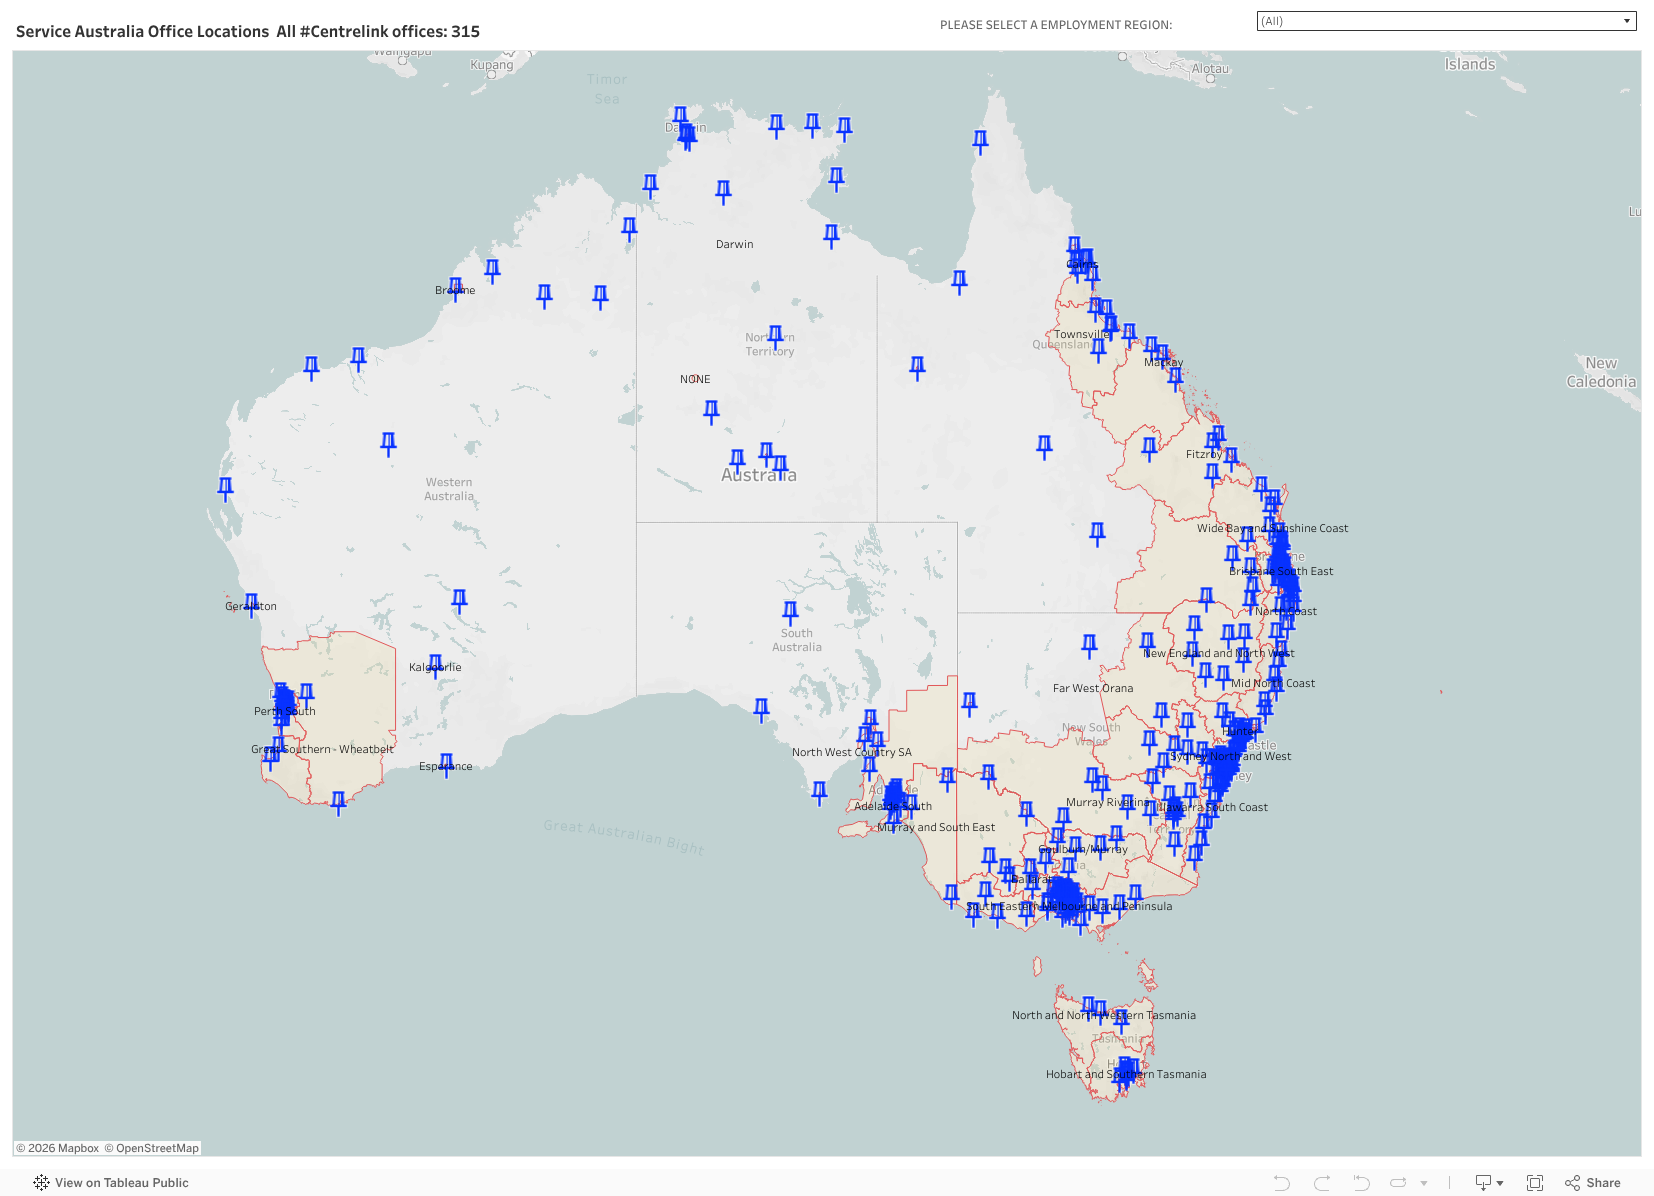
Service Australia Office Locations By Employment Region
Comprehensive mapping of all Service Australia office locations Organized by Employment Regions for strategic overview Includes Centrelink offices and service centers
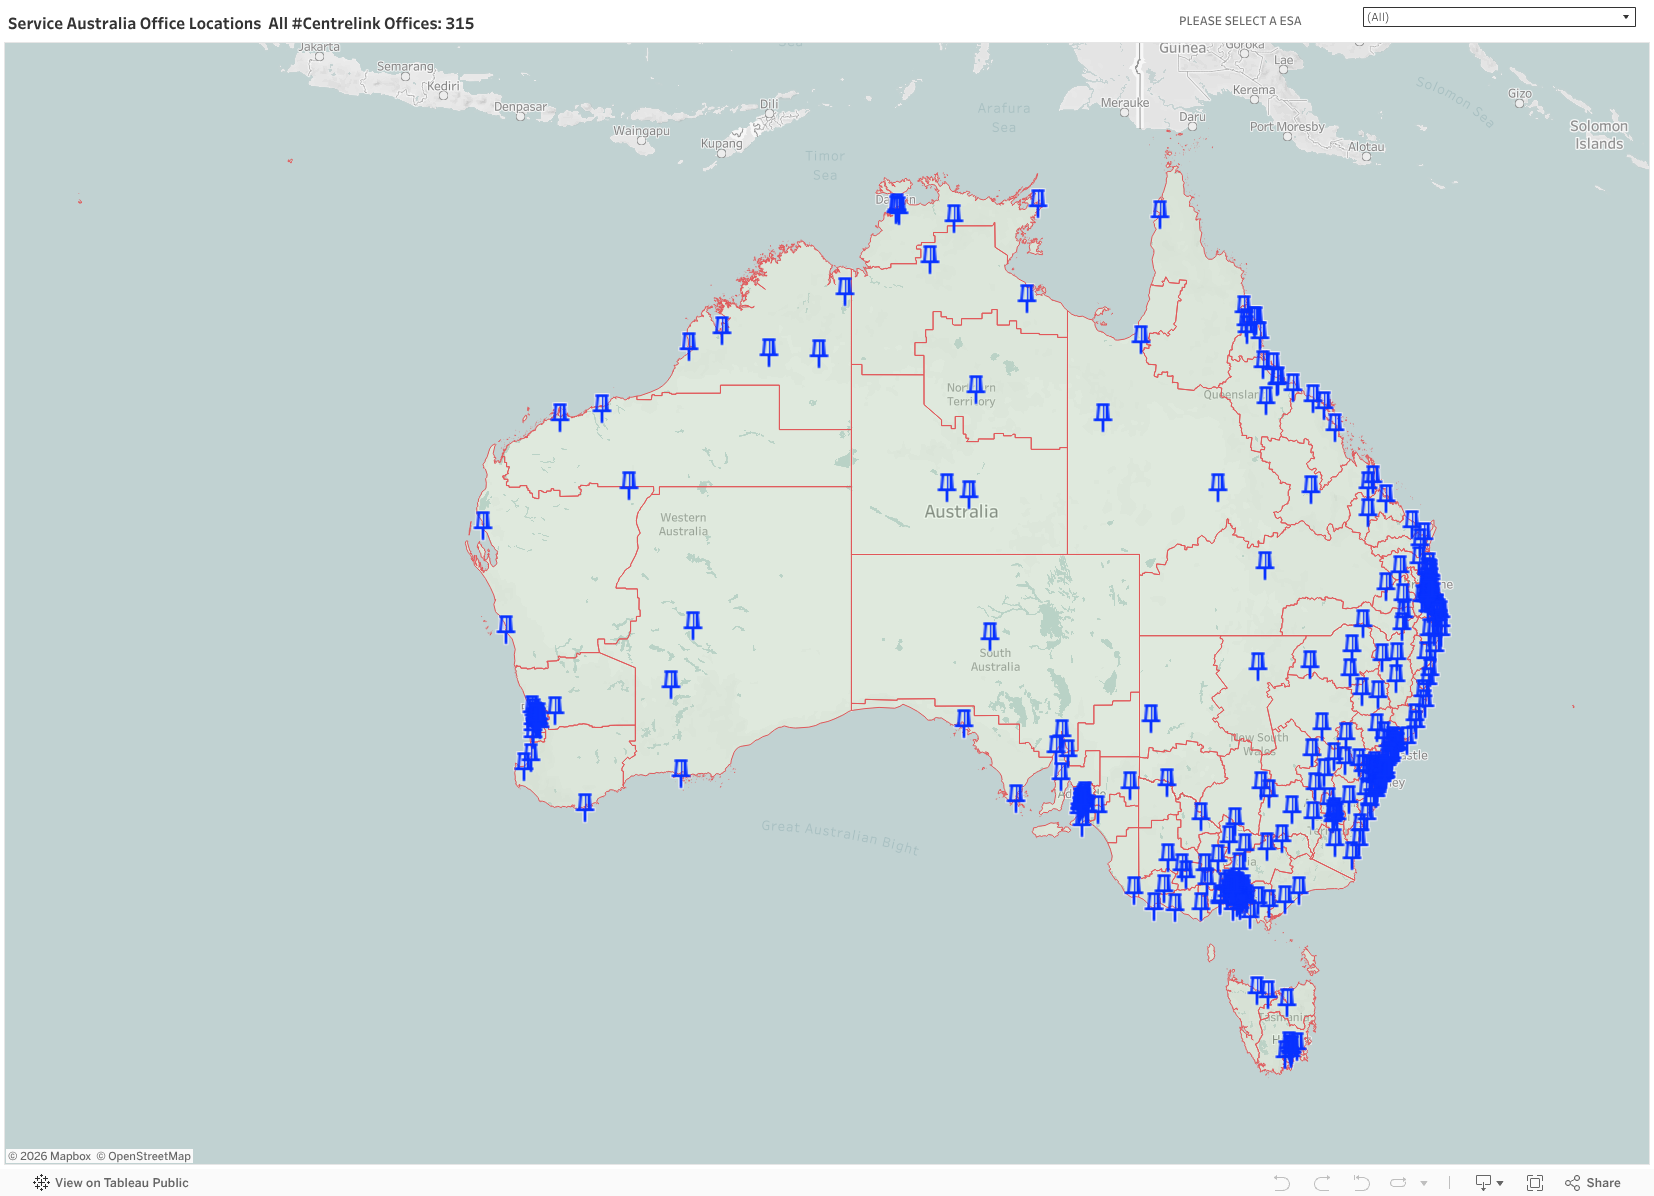
Service Australia Office Locations By Employment Service Area
Detailed breakdown by Employment Service Areas Fine-grained geographic distribution Helps identify service gaps and coverage areas
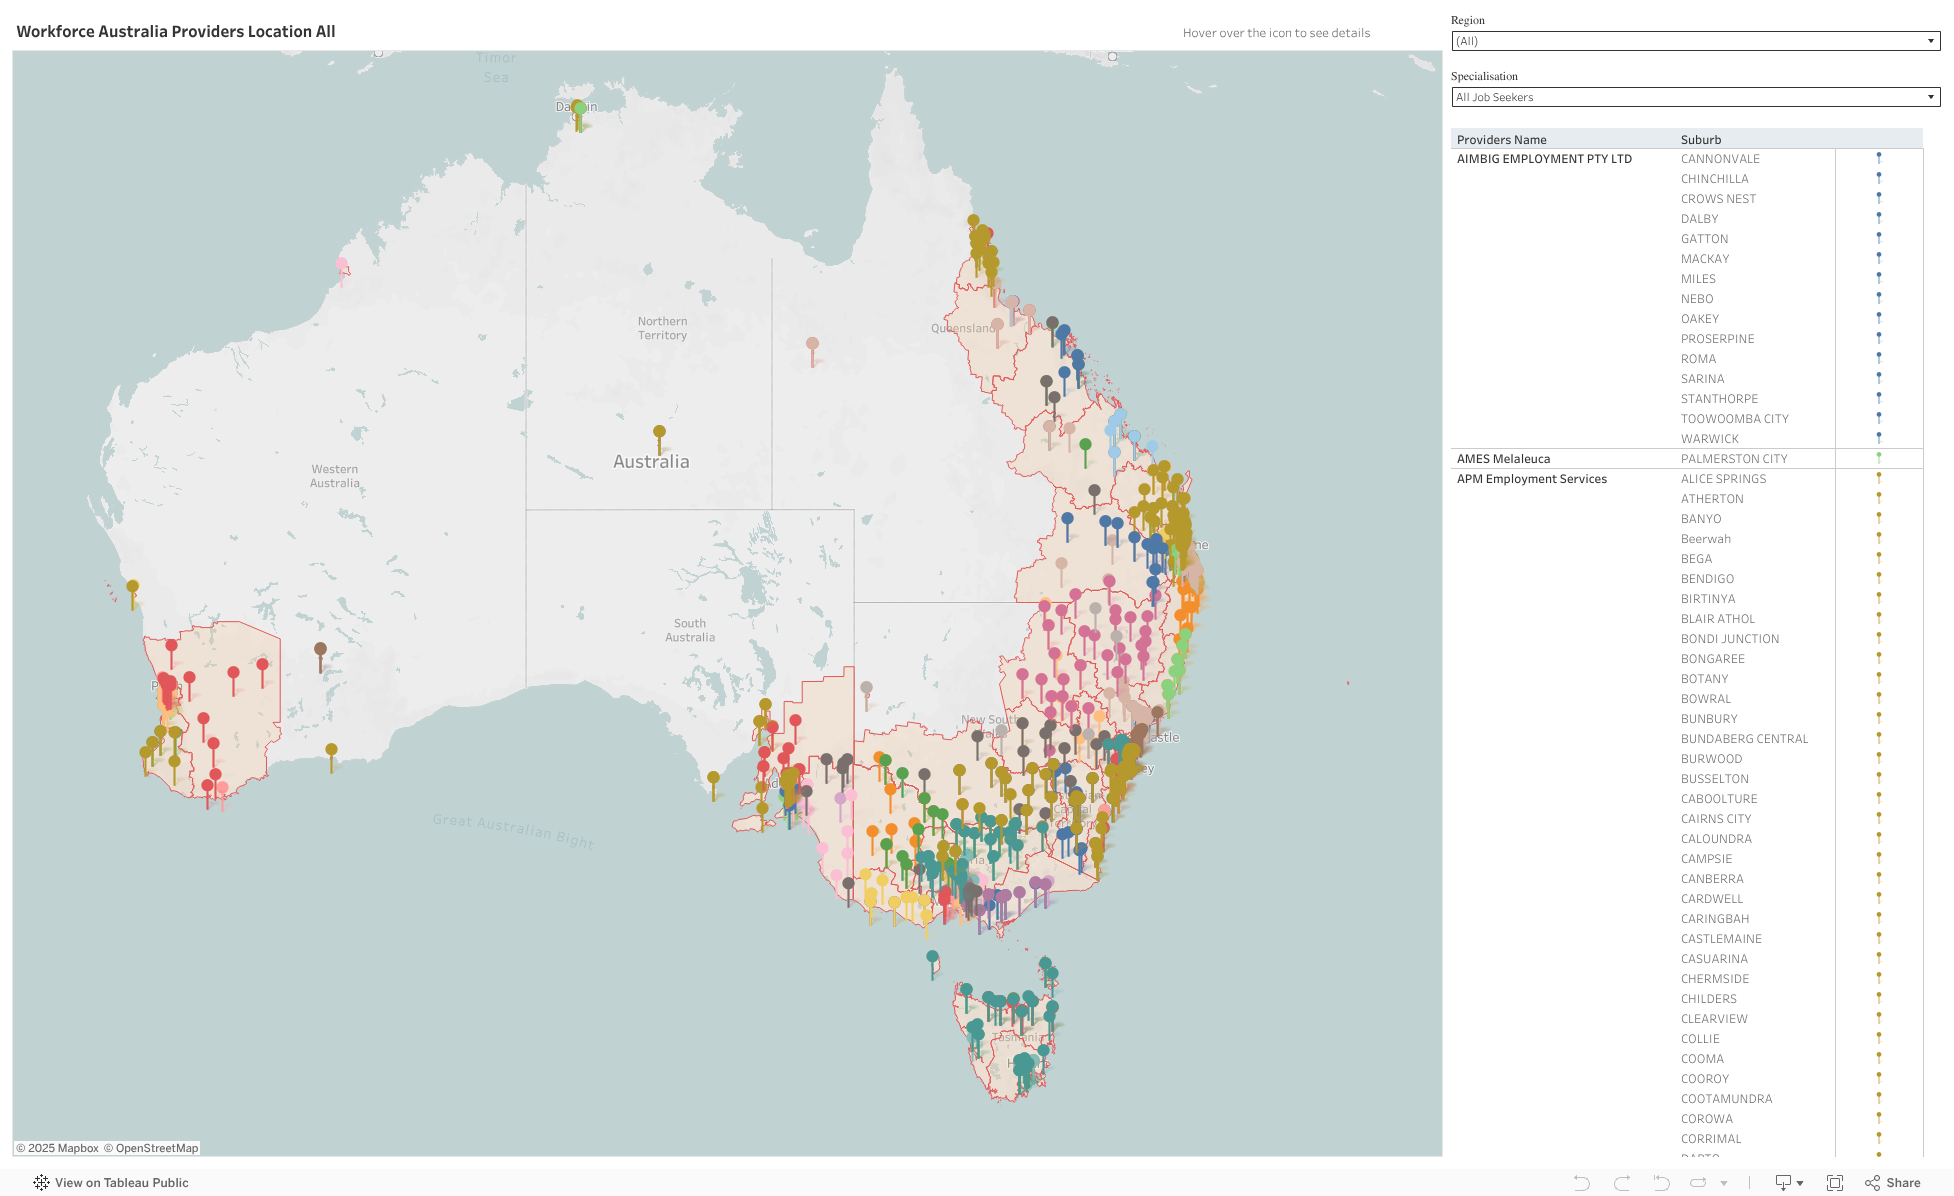
Workforce Australia Providers by Employment Region
This interactive map shows the distribution of Workforce Australia providers and their service type by employment region.
Transition to Work (TtW) program Providers by Employment Region
This interactive map shows the distribution of Transition to Work (TtW) program Providers and their service type by employment region.

Parent Pathways program Providers by Employment Region
This interactive map shows the distribution of Parent Pathways program Providers and their service type by employment region.

IEA Providers by Employment Service Area
This interactive map shows the distribution of IEA program Providers and their service type by employment region. COMING SOON
🚀 Access the Maps
📊 How to Use the Maps
Click any link above to open the interactive dashboard Navigate between maps using the tabs at the bottom Zoom and pan to explore specific regions Hover over markers for detailed information Use filters to narrow down your view
ℹ️ Data Information
📅 Data Currency: All information is based on the latest available data from relevant government departments and authoritative sources. 🔄 Updates: Data is subject to regular updates and changes. For the most current official information, please refer to government websites. 📈 Source: Department of Employment and Workplace Relations, Services Australia, and other relevant agencies.
🔍 Key Insights These maps help identify:
- Geographic Coverage - Where services are most/least available
- Access Patterns - How different regions are served
- Service Density - Concentration of providers in metropolitan vs regional areas
- Planning Opportunities - Potential gaps or expansion areas
Need help interpreting the data or have questions about specific locations? Contact us: hello@ozsparkhub.com.au